Here is my schedule. All tasks are once per day
Backup at 12:00
4 Jobs not run in parallel
Check at 1:00 (This takes 5.5 hours until the GCD fix is incorporated in a release)
Prune at 6:00
Does this make sense?

Here is my schedule. All tasks are once per day
Backup at 12:00
4 Jobs not run in parallel
Check at 1:00 (This takes 5.5 hours until the GCD fix is incorporated in a release)
Prune at 6:00
Does this make sense?
Why not put all steps into the same schedule?
It depends on how often your data changes and prune schedule that may be driven by your storage provider cost structure. Generally I’d think backup once a day is too seldom while check and prune once a day is way too often.
As an example, on my desktop i personally run backup every 20 min, check every month and prune every week.
For my B2 backups I would love to reduce the frequency of my check schedule, but I’m using Duplicacy Web-UI for handling my cloud backups and so far it seems that if a storage has not had a recent (or recent-enough) check completed then the dashboard view becomes completely useless. Is that some known issue? Is there a workaround that I’m not familiar with? Right now the only way I can get a working Web-UI dashboard is to have a 1:1 ratio between backups and checks.
Can you elaborate on that? Do plots and stats show wrong information? Don’t show any information? Can you post a screenshot?
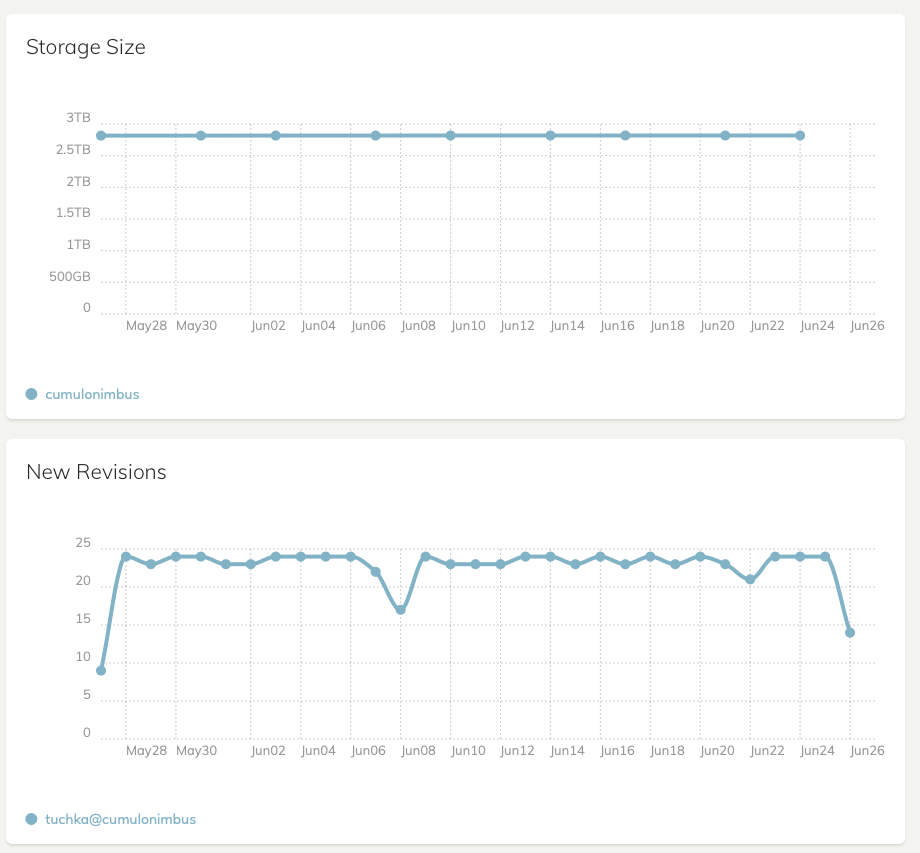
Here is a screenshot of my fairly recent web-ui instance (running on a Synology NAS, backing up to another Synology NAS – but the backend should not matter) with check twice a week and hourly backup.
Each graph updates at its own cadence and reflects current information. Do you see something else with back blaze?
Yes, if I stop running nightly check jobs, then both graphs just stop updating. They will have gaps in their data until I run a check job, then immediately after check succeeds the graphs will “magically” fill in with the missing data. I’ll update my check schedule to only run weekly and then in a few days after I have a bad-looking dashboard graph I’ll post a screenshot.
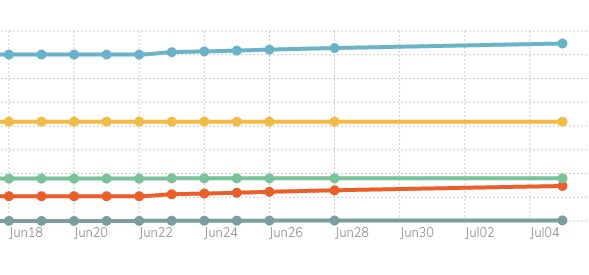
I have noticed something similar to @roland.cassini 's issue. I am also on B2.
And in my case, the New Revisions graph is plausibly correct.
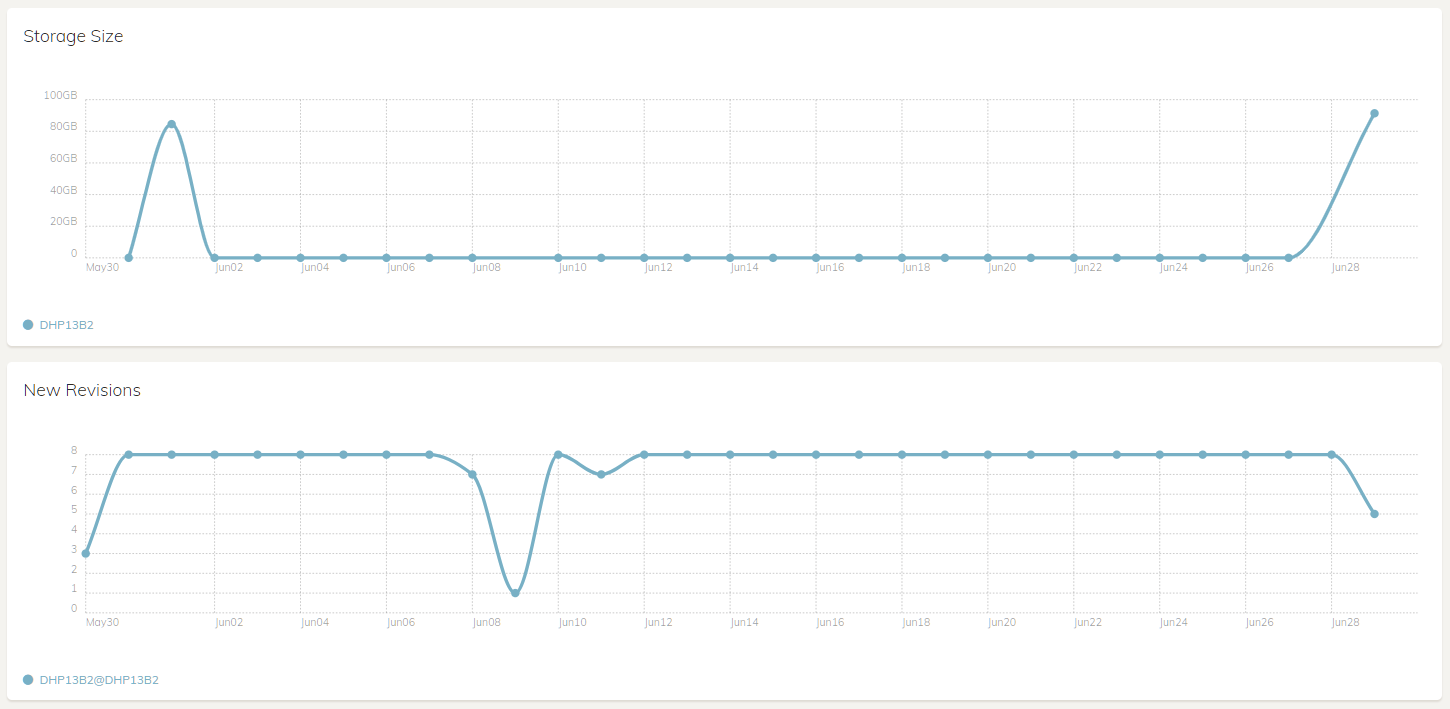
Here is what I see in my Web-UI Dashboard graphs now that I have reduced the frequency of B2 storage check jobs from daily down to weekly:
This is a snippet of the “Size” graph, but the “Revisions” and “Chunks” graphs show a similar pattern.
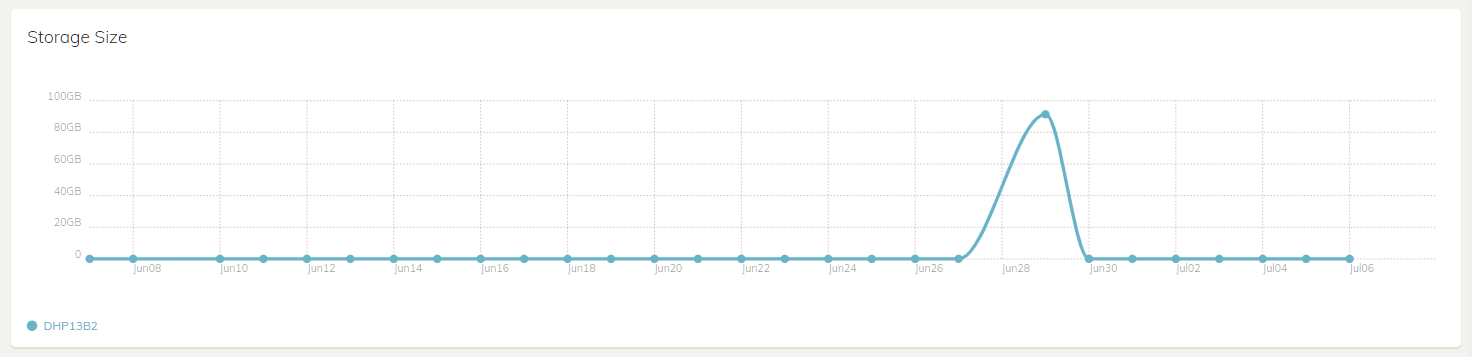
Here’s my Size graph. It only works on a day when a check operation occurs. I did a Check on 29 June, and it shows in today’s Size graph, and the one I posted earlier in this thread. All days other than the day a Check occurred show a Size of zero.
I have the same question in that, even though I want to run check via the GUI only on my main device with -all, if I don’t run check on individual laptops or other devices, the storage graph never updates.
Is there a way to get that to update on usage without actually running a check?
Those storage stats create by the check job are stored locally so there is no way to share with other machines.
I have backups running every 15 mins. How can I safely schedule a prune or check job so that it will wait for any backup job to complete…and the reverse case, if the prune job is running have the backup job wait. I want this schedule…
backup every 15 mins
prune weekly
check monthly
…and I don’t want thee jobs to collide or have a race condition.
They don’t need to wait for each other. They can run concurrently. Including from different machines. This is one of the duplicacy strengths — lockless concurrent design.