Memory Usage 128 GB?

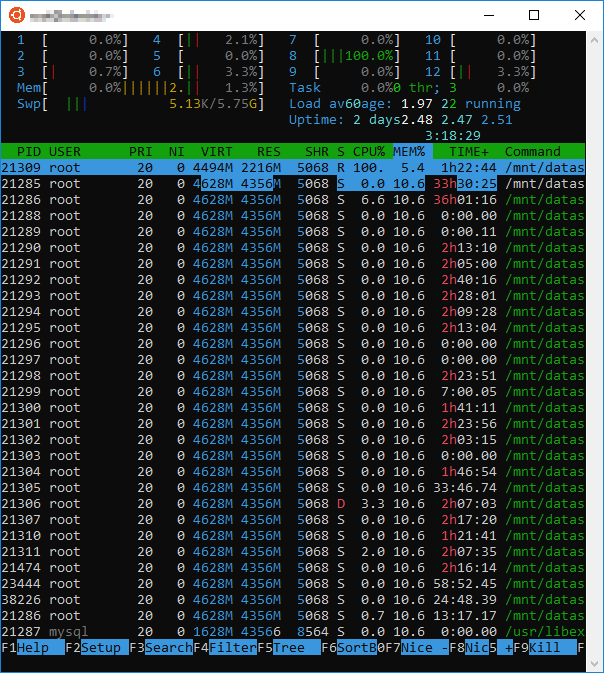
So according to my task manager, duplicacy seems to be using all of my memory and then some. There are 28 processes running, each at 4.6 GB each for a total of about 128 GB/ over 300% of my memory (40 GB). Only 1-2 processes and cores ever seem to be in use at a time (I guess since most time is spent chunking and this is single threaded). I have it set to 8 threads and to write to a log file. It’s about 8 TB of data.

I found the post about the DUPLICACY_ATTRIBUTE_THRESHOLD. Should I really set this to 1 or try to find a sweet spot. I don’t want to thrash the disk with a ton of individual reads in the main loop since the OS seems to be handling memory management and staying performant.

I’m just a little surprised at the moment and wonder if there is something more going on than a static 1 million attributes, unless they are loaded per process… not to mention I just moved this all over from a Windows machine and it only had 12 GB of memory. Also, why are there 28 processes? Are they all spun up and pending in a queue?

My questions are scattered, but I’m just looking for advice and an understanding of the software.

RELATED POSTS:


I think that is from multiple invocations of the CLI. How did you start the CLI?

All of these stay alive until the job is finished [edit: but afterwards all seem to close at the same time making me thing they are all from the same command. I was thinking the mulitple processes were how the program handled the multiple thread, but not sure why so many.] (checking in the logs using tail command). There aren’t multiple inits in the log file. It has done this every time since I switched [edit: to linux] (using the latest released version of the linux release on github).

The CLI is started like so
[user@host path/to/repository]# /path/to/script/Duplicacy/duplicacy -log backup -storage local -threads 8 -stats >> /path/to/logfile

Is that htop? Could this explain why there are so many listed? Try press Shift-h.

I’m currently watching a duplicacy copy -threads 4 command taking place over sftp, and it’s showing 9 threads in htop, 4 of which are at the bottom of the list, and 4 at the top with >0.0 CPU.

Pretty sure each thread isn’t using that much memory, it’s all probably shared between the main process. In fact, as far as I can see, your screenshot doesn’t show much memory usage at all(?).

Awesome! User error! Likely it was only 1 task at the claimed 10%. I will check this next time.

It showed no usage because of the way I had the window resized… it didn’t fit on the screen. It was reporting 2 GB free of 40. I don’t know what was using so much memory, but I’m guessing it wasn’t duplicacy based on your response. Thank you and sorry for the confusion.

For sysadmining and monitoring i always have a second option with Glances - An Eye on your system.
Maybe that helps any of you.

Also pay a bit of attention that it uses a bit more cpu compared to top or htop due to all the plugins it has.

2 Likes