Search in Restore etc

I’m currently evaluating Duplicacy and have come across some show stoppers.

First up I need to be able to Search for files in Restore. I’ve searched the forum and see this is a much asked feature request going back a long time. Is this planned for the near future?

In Restore I’d like to see only the files in the selected Revision. It appears as though I see files from this and and all earlier revisions.

In Restore the Revisions drop down list is in the opposite order to what I would expect. ie, Most recent revisions should be displayed first.

The Dashboard is very pretty but IMO fairly useless. What I really want to see is a simple List of backups, most recent first and whether they were successful and if not why not.

I am currently using Duplicati and a Synology NAS etc. for backups. Duplicati handles the issue above nicely.

Thanks for any help.

2 Likes

Agree with everything, (especially on the uselessness of the graphs and them being on the front page and that generally restore workflow needs compete overhaul; preferably with adding FUSE support so I could explore the revision with existing OS tools) except:

You see only files present in the specific revision — the file list does not get populated until you select the revision from the list.

But what is missing is the opposite — enumerating revisions for a selected file (ideally with support or external diff tools and quick look). That is an extremely useful functionality that most other backup tools implement, and I find myself needing it quite often. Nothing that can’t be done with a few lines of script (and honestly most power of the Duplicacy is in the CLI engine) — but it should be in the UI.

This is an easy change. I’ll include it in the upcoming release (which was supposed to be out last week but I wanted to include a few more changes).

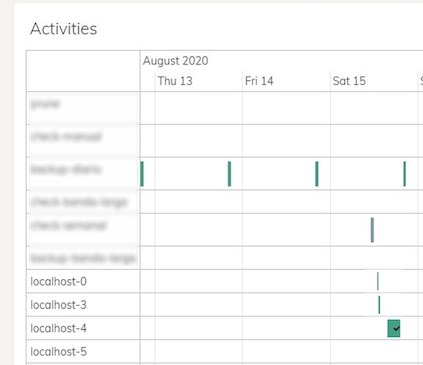
A backup list was what came to my mind first when designing the dashboard page, but then I realized the Activities graph is more intuitive and gives more information. For instance a job that took an unusually long time to complete is very easy to spot with the Activities graph.

In fact, the Activities “board” is the only one I use, very practical, with “zoom” etc.

However, the fact that jobs appear as “localhost-xx”, makes half of it useless, you can follow the schedules, but not the individual executions.

The line labels should be the backup ids in these cases.

activities

I agree with this - has been very useful in the past.

However, recently I noticed a situation where one of my 4 or so repositories in the schedule, was failing. Yet the zoomed-out Activities was all showing green for most-recent backups, and red for ones several days ago. Then I zoomed in - and ALL the backups changed to red.

Basically, those rendered lines are too close together in the zoomed-out view, with greens overwriting reds. Fairly deceiving. It was only an aliasing issue with the earlier backups that caused me to zoom in, otherwise I wouldn’t have noticed it.

Perhaps, as a workaround, the graph should be rendered with greens first then reds? (Are there yellows? I seem to remember yellow…)

I have to scroll my 27" monitor down to get to the Activities Graph. Given that this is the only useful item on the dashboard it should be at the top. It looks like the graph doesn’t scroll automatically horizontally to show the current time, so more effort on the users part.

The narrow green and red lines aren’t easy to differentiate for my eyes. I have to hove the mouse to see a tick or cross. It’s also not obvious precisely what time a line equates to.

As per my first post, a list of jobs with a status would IMO be far more useful. The Relica dashboard does this as does Duplicati.

And without Search in Restore it Duplicacy remains a non- starter.

That’s not what I’m seeing. I see all files regardless of the specific revision I select.

Are you sure that some files you’re seeing are not supposed to be in the revision you select? The web GUI just runs the list -files command to list the files in the given revision.

What about the New Revisions graph? This graph doesn’t show the failed backups, but you’ll easily notice it when there is a missing point (or if the number of revisions on a particular day is less than usual)

New Revisions kinda helps - normally I’d have 12 backups a day - but I do occasionally have natural dips due to restarting PC and forgetting to start Duplicacy. (On my own PC, I don’t use service mode, and setting it up to not start the browser isn’t immediately obvious, though I know there’s a flag for it).

It just doesn’t directly show failed backups, or indicate an issue until at least a day has passed…