Optimizations for large datasets

If you don’t run (or plan to run) very large datasets with :d: (we’re talking 10TB+) and/or not someone who doesn’t look into/make changes to :d: codebase, you can probably ignore this thread :wink: This is mostly to discuss some implementation details with @gchen (really hope to see some feedback here) and whoever else is interested in improving :d: code. Hopefully, based on this discussion we can make a PR to be merged into mainline. So here it goes.

There was a post not a long time ago by @Shaun, who wanted to use :d: with hundreds of terabytes, if not petabytes, of storage, and it seems that no one really knows how it would behave on that scale. That got me thinking about profiling for large datasets, as I have one that is reasonably robust for that purpose. Here is an overview in a nutshell (numbers are rounded):

  • 20TB storage on OneDrive
  • 4mm of chunks (default sizing)
  • 7 snapshot ids
  • 1000 revisions (total, not per snapshot id)
  • Mix of file sizes, from many small(er) ones to fewer large ones
  • duplicacy codebase is branched off 24c2ea7 (so a bit after 3.1.0)

Current setup is perfectly viable, but I want to make sure that it still is if we push the scale up one order of magnitude, so ~200TB/40mm chunks/10000 revisions. Given my observations so far, this would be problematic in the current version, but can probably be addressed without making extensive changes to the code. Pushing into petabyte territory (so 2 orders of magnitude up) will likely need much more extensive changes, so this is out of scope for now.

The idea is to look for some low-hanging fruits to make performance noticeable better for large datasets, at least for the most common usecases. There are 3 metrics that roll up into performance: memory consumption, execution time and disk space (caching/temp files). IMO these are in general priority sequence, as exceeding available memory makes it a hard stop for a particular usecase (physical memory is limited, even swap often is), or makes it unbearably slow (even with swap certain operations that require random access would be non-viable). In this context longer execution times can often be tolerated within reason as it rarely leads to hard stops. And disk space for caching/temp files is likely the least of a concern (again, within reason).

Now, for the good news. In my current setup incremental backup has excellent performance characteristics out of the box. I don’t see any significant memory load, execution times are really fast even on a lower-power box and best of all, given what I know about :d:, there is no reason to believe that blowing up the dataset by 10x will make things significantly worse. This is excellent news, considering that this is the most common operation out there. I see no reason to do any additional optimization in this part of functionality, really happy how it works.

Restore functionality is important, but is rarely if ever used, so I haven’t looked into that. Unless memory consumption blows up (it shouldn’t for restore), performance is unlikely to be critical.

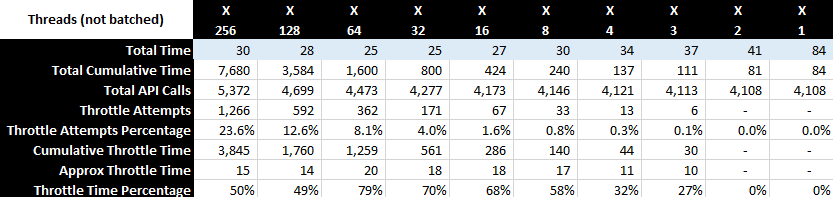
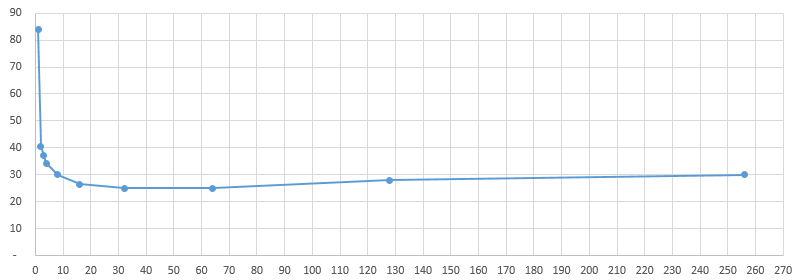
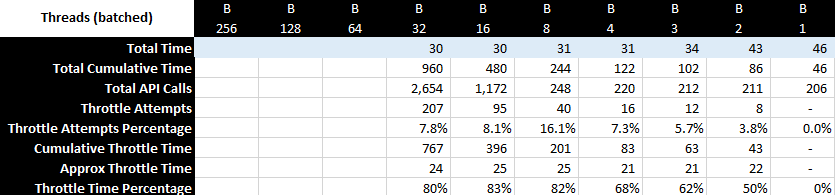
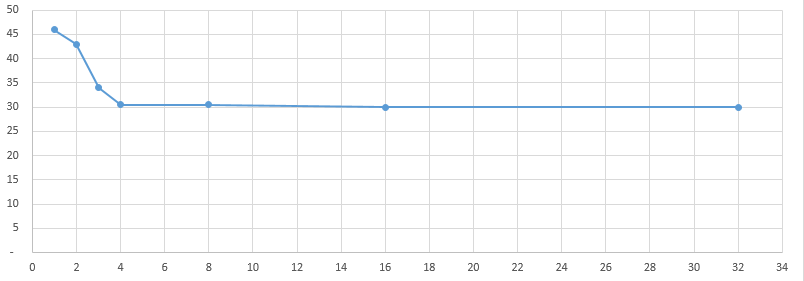
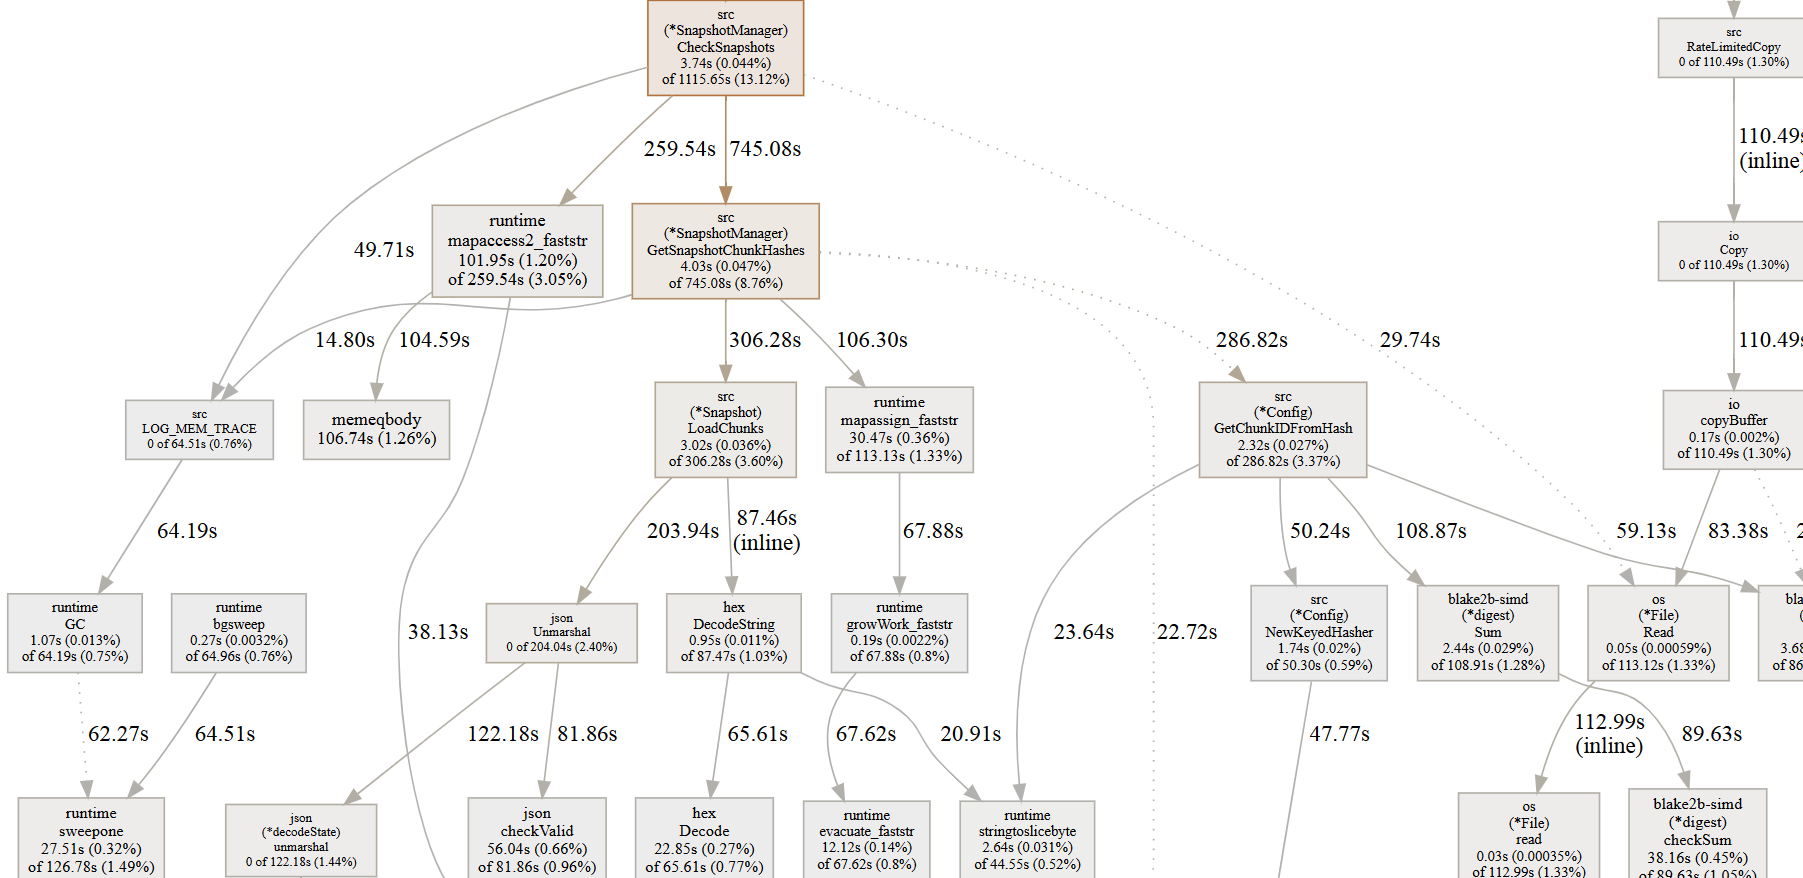
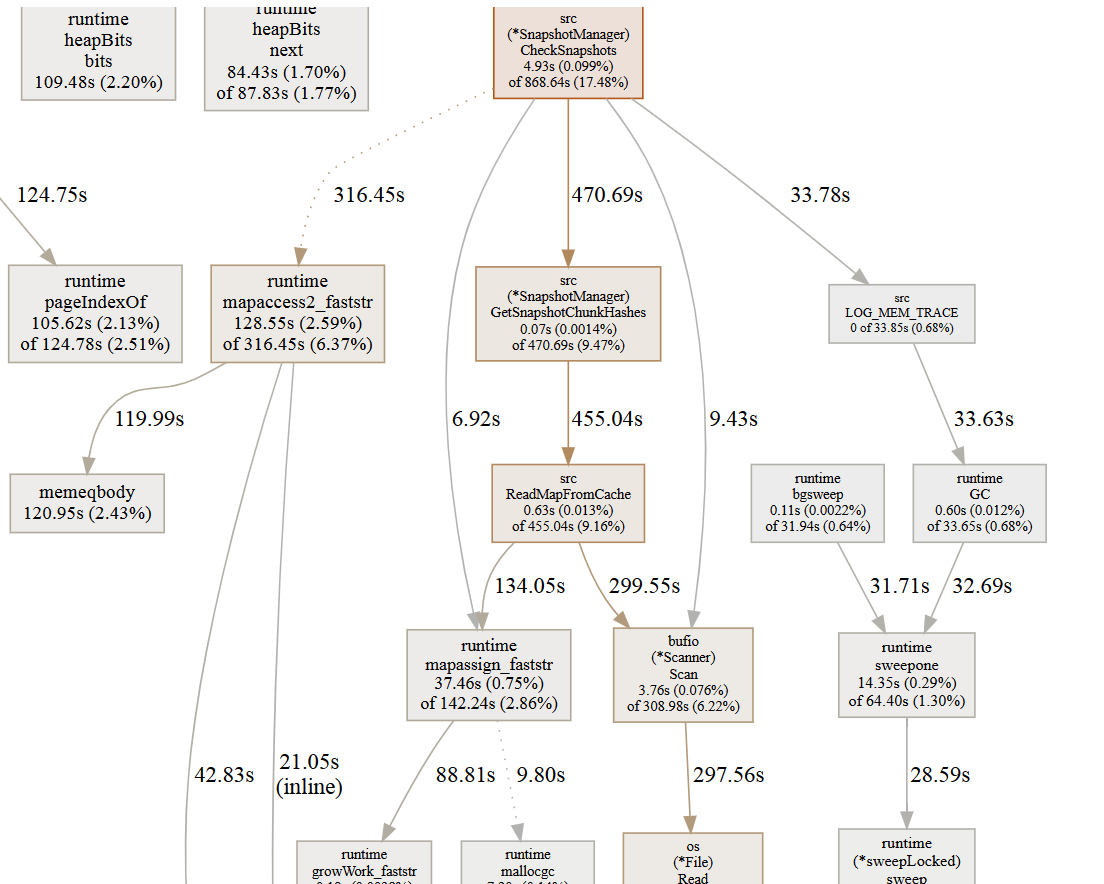
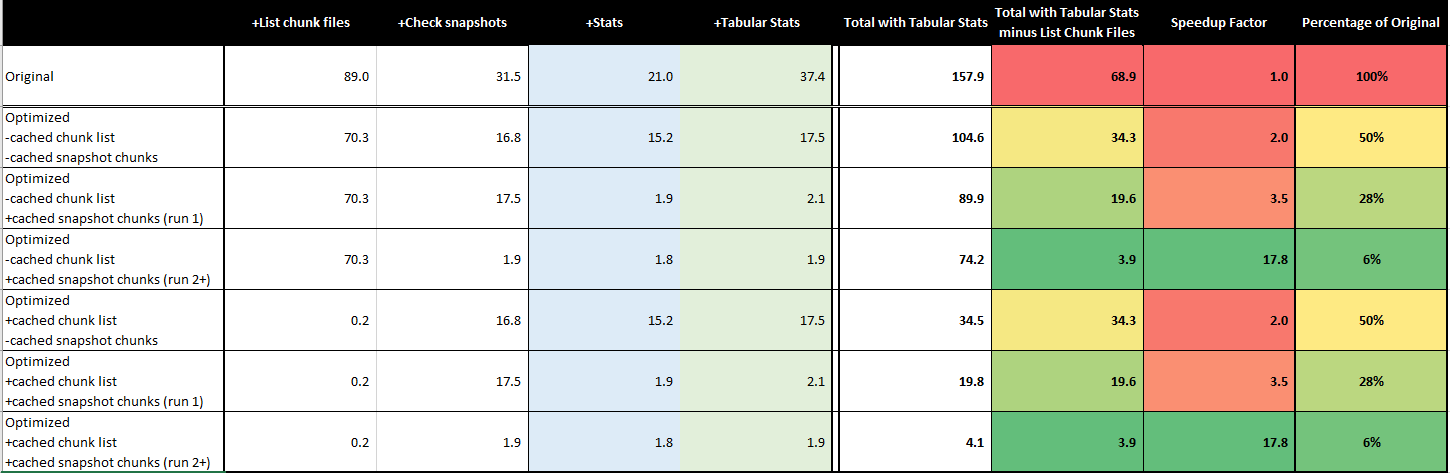
Which leaves us with 2 other components where you can foresee issues: check and prune. Prune is something I will look into later as I rarely run it, but check I like to run after every backup (so daily). So let’s take a look at check functionality (to be continued).

2 Likes

So let’s take a look at check functionality. There are 3 types:

  • check files
  • check chunks
  • regular check (check snapshots/revisions I guess)

I personally think that check files is mostly pointless ;), so I don’t worry about it. Check chunks is quite a different animal from regular check; I don’t use it so it is out of scope for now. Having said that, every new chunk is only validated once (check cached on storage), so there is that.

Which leaves us with the regular check, and the usecase is checking all snapshots and all revisions, and generate stats (tabular in my case). This is a very common operation, and it’s performance is not amazing as it is, and will be significantly worse with larger datasets.

With vanilla CLI, and running check -tabular, it takes about 2.5hrs to complete the check (longer with a slower box), with peak memory consumption of about 5GB. Even if we project linear increases (it is worse, more on that later), at 10x scale we could be looking at 25hrs+ and 50GB of memory utilization. Neither metric looks amazing, though may or may not be viable depending on your circumstances. Again, in reality this would be quite a bit worse. 100x… I don’t think so, not right now :wink:

So lets take a closer look and see if there is some room for improvement. So here are the main steps in checking snapshots (SnapshotManager->CheckSnapshots):

  • List all files in chunks dir on storage: 70min / 500MB
  • Create chunkSizeMap: 0min / 1200MB
  • List all snapshot ids: not material
  • Download all snapshot revisions: 15min / 1200MB (no material increase)
  • Check existence of all chunks in all revisions: 30min / 3400MB
  • Calculate stats: 30min / 4700MB

So let’s take a look at each step in detail, and look for improvements:

=List all files in chunks dir on storage: 70min / 500MB

This step seems to be pretty efficient as it is, doing manager.ListAllFiles on chunks directory. The reason it takes that long is that there are 4mm chunk files to list, and OneDrive API uses paging for requests, with 1000 items returned being the max for a single call. So that’s ~4000 requests, and with ~1sec per request in my setup (accounting for threading), so this looks about right. There is not much to improve on :d: side given current design. Now, if you would have lower latency to your storage, this number will go down, perhaps quite significantly. And check needs a complete list of all the chunks to do its job, so I don’t think it is possible to cache anything here.

Memory utilization also looks efficient, as ListAllFiles returns array of filenames and array of filesizes, and with 4mm chunk files we’re looking at ~130B per chunk, which is close enough given that file names are 64 character strings.

Now if you’re designing your storage from scratch, and you expect high volumes, one thing that will have a significant impact on pretty much all the metrics in check would be total number of chunks. And in order to reduce that you need to specify larger chunk sizes. E.g. I would expect the same check performance as currently even if I’d have 200TB in storage, as long as I have the same number of chunks (e.g. chunks would need to be 10x bigger on average). Unfortunately, I don’t think you can adjust chunk sizing for existing storages, or even convert existing storages for the larger chunk sizes while keeping revision history (@gchen?). Listing of chunks also only depends on total number of chunks, it doesn’t depend on number of revisions (but some other parts of check do).

1 Like

=Create chunkSizeMap: 0min / 1200MB

This is a fairly trivial step that converts array of chunk files names and array of these file sizes into a map. The reason it is mentioned is that while execution is fast, memory consumption is not as currently map is being populated from arrays, while all these structures reside in memory. Hence to 500MB for arrays we add another 600-700MB for the map to get peak consumption to 1200MB. It does go down after this step at some time as arrays are no longer used and can be garbage collected.

Creation of the map can be done directly while (instead) of listing files, but it will be a bigger change. The easier option is to dump arrays into temp file on disk, release the memory, then read temp file while populating the map. Implementation is fairly easy and non-intrusive. It uses ~270MB temp file, and execution speed is not significantly affected. This might not be critical if other parts of the check take more memory at peak (as currently is the case), but there is an extra benefit that this temp file can be reused for testing thus skipping previous step of listing all the files on storage.

So this improvement saves about 600-700MB in (temporary) memory consumption, while using ~270MB temporary file.

1 Like

=Download all snapshot revisions: 15min / 1200MB (no material increase)

This step is the one that should be much faster as most of the things should be in disk cache (after inital population). Here is main part of the code:

	for snapshotID = range snapshotMap {

		revisions := revisionsToCheck
		if len(revisions) == 0 || showStatistics || showTabular {
			revisions, err = manager.ListSnapshotRevisions(snapshotID)
			if err != nil {
				LOG_ERROR("SNAPSHOT_LIST", "Failed to list all revisions for snapshot %s: %v", snapshotID, err)
				return false
			}
		}

		for _, revision := range revisions {
			snapshot := manager.DownloadSnapshot(snapshotID, revision)
			if tag != "" && snapshot.Tag != tag {
				continue
			}
			snapshotMap[snapshotID] = append(snapshotMap[snapshotID], snapshot)
		}
	}

ListSnapshotRevisions is fast (1 API call per 1000 revisions at each snapshot id), but DownloadSnapshot is not. DownloadSnapshot mostly deals with cached metadata, and it is fast, but it seems that it also does some API calls on the storage when it doesn’t need to, and that brings speed down.

This is evident when checking debug logs. There are tow culprits (in DownloadSnapshot):

	manager.storage.CreateDirectory(0, snapshotDir)

and

	// We must check if the snapshot file exists in the storage, because the snapshot cache may store a copy of the
	// file even if the snapshot has been deleted in the storage (possibly by a different client)
	exist, _, _, err := manager.storage.GetFileInfo(0, snapshotPath)

So the first one attempts to create snapshot/Name directory on the storage every time DownloadSnapshot is run. The vast majority of time the directory is already there. Even if it is not, DownloadSnapshot probably shouldn’t try to create it, the function cannot succeed with or without this folder created (there are no snapshots). I think this attempt to create snapshot/Name directory on the storage on DownloadSnapshot should be removed altogether, this saves 1000 API calls right there. @gchen, any reason NOT to do that? At the very least it should be moved under checkExistence gate (see below) for when we know it does exist.

The second part is more subtle, but can also be improved on I believe. I don’t think the comment is entirely correct - while there are cases where we DO need to check for existence of revision in storage, there are cases where we KNOW these are fine (outside of race conditions which this check does not prevent as there is no locking of the storage).

In particular, when looking at invocation of DownloadSnapshot from CheckSnapshot (see code snippet above), if this check is valid if len(revisions) == 0 || showStatistics || showTabular, we DownloadSnapshot on all revisions that we just listed (and this happens in 1 API call), so we know these are fine and there is no need to recheck individual revision files one by one (1000 API calls). @gchen, any thoughts on that?

So what I did is add checkExistence bool flag to DownloadSnapshot which enables or disables GetFileInfo check. And in the cases when on invocation we already loop over known existing revisions (as is the primary use case), we never hit storage API and only work with cached metadata.

Memory usage of this piece is minimal, but these two changes turn 15min runtime into 10-15sec run time for this step. This sounds like a worthwhile candidate for the PR.

1 Like

=Check existence of all chunks in all revisions: 30min / 3400MB

OK, so in this step we finally loop over revisions and verify existence of corresponding chunks. At this point onwards there is no access to storage, so all this utilization has nothing to do with which provider it is on, all this is purely internal to :d:. So given the nature of the task, I expected this to be dominated by map access/string comparison and such, but this is not where most of the time is spent. Here is cpu profiling of CheckSnapshots (not including stats). Don’t mind absolute numbers, look at relative values:

While map access is non-trivial, something else (GetSnapshotChunkHashes) takes almost 3 times as much time (and also generates quite a bit of mem utilization). Despite the name, in this particular case it is really getting corresponding chunk ids, that’s all this function does. It primarily spends time in LoadChunks on JSON unmarshalling, as well in GetChunkIDFromHash churning out BLAKE2. Both contribute to execution time, and unmarshalling also generate quite a bit of memory utilization IIRC (don’t have heap profile handy)

The thing is, this information (corresponding chunk ids per revision) is static. For any particular revision once it is set, it will return exactly the same output (until this revision is deleted). It will never return anything different for a particular revision (:d: doesn’t reuse revision numbers).

Sounds like a perfect candidate for caching! Well, maybe :wink: I did implement that, and this is how the same profile looks now:

It is noticeably faster. More so, right now out of this faster time it spends 300 (profiled) seconds in outright file reading from disk. Right now, this cache is located on a NAS with spinning RAID disks, so access time is not great, and bandwidth is limited by 1Gb LAN. If this cache is to be located somewhere on local SSD drive, this could be even (much?) faster. Even better, because we don’t need to create many of the additional data structures, peak memory utilization goes from 3400MB to about 1900MB.

Sounds great, but is there a catch though? Well, yes. The cache space required for this step is pretty significant. Current setup for snapshots cache needs ~2.5MB of disk space; cache for chunks (just metadata) takes up ~2.5GB of disk space (these are vanilla numbers, no changes here). Cache requirements for snapshotchunks (that’s my implementation of the above) needs additional 15GB of space.

Now, this is certainly not outside of realm of reasonable. Even at 100x at 1.5TB this is still quite doable, especially considering potential savings of 100GB+ of required memory and hours if not days of runtime. But in less extreme usecases it might not be desirable (e.g. space in limited VMs could be not sufficient, or in general it might not be expected to generate that kind of cache volumes). So it sounds to me that this is one of these cases where user can choose via some tunable parameters whether or not they want to reduce check execution time and memory consumption at the expense of non-trivial cache expansion, probably with the ability to specify separate path for this cache as general purpose :d: cache might not be the best location for this one.

The cache size could be reduced by a factor of 2 easily by using binary hash representation rather than a string. This will also speed up things as effective bandwidth of disk I/O would double.

One thing to keep in mind is that this cache would grow in non-trivial manner with additional revisions, even if these revisions do not increase storage size. So static snapshot that generates nil incremental changes daily (but this still generates revisions), would expand cache significantly. And so will check execution time, whether or not cache is being utilized or not, that’s just the nature of check. For snapshots like these you would definitely want to prune revisions aggressively, and nil revisions do not add anything to your backup/restore capability, but it will slow down check quite significantly over time (and we’ve already seen evidence of that with very high number of revisions).

So bottom line is, caching chunk ids for each revision reduces execution time from 30min down to 15-20min (and more with faster cache), peak memory consumption from 3400MB down to 1900MB, at the expense of 15GB of on-disk cache (could be half that with binary encoding). Could be a user option to enable/disable.

There are other potential options for optimization with respect to speed/memory as it relates to running maps of hashes represented as strings, but right now it would gain much less, with potentially much more intrusive changes. Having said that, reducing memory footprint even more might be appealing, but this is something for later time.

@gchen, any thoughts on this?

1 Like

=Calculate stats: 30min / 4700MB

And last, but certainly not least - stats. This is still work in progress, so stay tuned. But obvious observation is that stats calculation is relatively slow, and takes A LOT of memory. So if you don’t need it, turn it off, it will save you quite substantial execution time and memory footprint.

There are some things that are unconditionally collected at previous steps (e.g. chunkUniqueMap etc) that are only used if statistics are shown. If stats are not selected, we should disable population of these structures as these have quite significant memory footprint.

Also, it seems that most of the time/memory in stats (at least tabular ones) are spent on calculating unique/earliest seen revision for chunks. While these particular stats might be useful, often they are not, so it may make sense to get a switch that allows users to see most of the stats without doing the most expensive ones. This may save quite a bit in time and memory. Some (most?) of the remaining stats could be calculated in a previous step on the fly, without looping over revisions all over again.

Having said that, it seems there is a lot of improvements that could be made for stats, I don’t think it was a focus until now (which makes sense as it really is auxiliary functionality). Stay tuned.

1 Like

This is great analysis!

Maybe the calls to CreateDirectory and GetFileInfo can be completely removed. Sadly I don’t remember the corner cases where they are necessary if there are any (I’m a bad commenter). What you did is safer and should be the first step to take.

I’m not sure about this one. The reduction in both time and memory looks not much to me, and excessive caching can lead to some confusion when revisions are deleted.

This time can be significantly reduced by using multiple threads. The Google Drive backend has this capability and it should be similar here.

Right now, I can see that we’d need to check for existence if set of check revisions is specified explicitly, and there are no flags for calculating stats. In this scenario we never list all revisions, and loop over what’s specified by the user. In this case it makes sense to check existence of revisions as it is entirely possible that some do not exist on the storage.

Right now I ignore this case, so we fall back on the current behavior with extra checks. But it’s not difficult to implement more efficient support for this case as well - we’d need to list all revisions in all cases (this is not heavy, at 1 API/1000 revisions in this case), and then we can figure out which specified revisions do and do not exist on the storage (rather than checking one by one via storage API). So ultimately, this check can be removed altogether, but for now I didn’t bother.

As I said, I don’t propose this extra caching to be default behavior, as for many use cases the gains are not material. But for more extreme cases they are. The numbers I provided were just for initial very crude implementation, and it gets better. The thing is, with the current behavior of regenerating revision chunk sets on the fly there is only so much that can be done in the way of optimization. Most of the time and memory is spent in code external to :d:, namely JSON unmarshalling and BLAKE2 calculations. There is not much that I can think of that can significantly impact that part without some kind of caching, outside of writing some custom JSON unmarshalling for simplified subset, but this sounds quite intrusive, and I am not sure that it will gain THAT much.

Caching option, however, is simple, and there are still quite a few places that can be optimized. For instance, I merged all supplementary chunk info maps (size map, unique map and snapshot index map) into a single map, and made sure that lookups and updates are only done once per revision (in most cases). This generated pretty massive memory savings - we’re down to 2300MB peak for on-the-fly version, and down to just 1100MB (!) with extra caching for this step. Even at 10x these numbers, it doesn’t look too bad anymore.

Speed differences are also getting more meaningful - while I did run with map optimizations per above with and without cache, without cache I did not observe much of a runtime difference (only memory), so we were still at about 30min for the step (there are some other minor differences with previous runs, so it does run faster than before, but not by much). Cached version, with cache now on SSD (but not converted to binary), clocked this step at about 12 minutes (!), and I am pretty sure there is still some room to squeeze more performance from there. Almost 20 minutes difference (especially at target 10x scale) is pretty meaningful IMO.

Deleted revisions should not be an issue. First of all, because revision ids are not reused, even if we don’t do anything extra, additional cache entries won’t be accessed (because corresponding revisions are gone). The only bad thing about this is that cache could be bigger than it needs to be, which is not a huge problem, really. As this is a cache, it can always be removed and regenerated from scratch, there is no unique information out there. But even better, we can fairly easily maintain the cache as when we list all revisions within check (happens often, or perhaps will be happening every run as per section above), we can list entries in the cache (this is very fast, this is cache) and remove all entries that no longer correspond to the listed revisions. This maintenance step is fairly trivial in both time and memory consumption, and is not hard to implement.

All these numbers are already with 4 threads :wink: More than that and I’d be running into API rate limits. These API calls are pretty costly, even with multiple threads…

OK, so I finished the bulk of optimizations for the check snapshots functionality, PR is here: Optimized snapshot checking (with optional stats) by sevimo123 · Pull Request #642 · gilbertchen/duplicacy · GitHub.

Results on my dataset look pretty amazing if I say so myself :wink:

Basically, if we ignore listing of file chunks on the storage (this has little to do with :d: itself, it can be practically instantaneous for local storages, or may take 90+ minutes for remote API limited ones) and focus on internal check processing, I went down from about 70 minutes of checking with tabular stats in the original version, down to less than 4 minutes when using cached snapshot chunks (~8GB on disk). This is almost 18x times speedup! Even with snapshot chunks cache disabled it is still faster, but now at a pedestrian 2x times speedup.

Memory consumption is also significantly improved, from 2.5GB floating / 4.8GB peak for the original version (with tabular stats) down to 1GB floating / 1.7GB peak when using snapshot chunks cache.

There are a few new parameters that can be added into preferences keys for a specific storage, or used via environment variable override as per usual with DUPLICACY_storagename_ prefix.

  • check_reads_chunk_filelist_from_cache_only - if this is set to true, then listing of chunks files bypasses pulling it from storage (could be very slow for remote storages) and reads it straight up from cached file on disk (this file is regenerated every time listing IS pulled from the storage). Most of the time it should be set to false (as is default) as most of the time we want to see the most recent chunk file list as this is core functionality for check.
    There is couple of usecases where it is super useful - debugging anything related to large datasets (e.g. in order for me to get to any relevant check functionality, I’d have to wait for 1.5hrs of file listing, which is not super exciting). Another one is when you want to run a different check when you know there were no changes on the storage, e.g. you normally run check with no stats, but now want to look at tabular stats, and normally that would take 2-3 hours, but with reading filelist from cache it can be done in less than 5 minutes.
  • snapshot_chunks_ids_cache_enabled - if set to true, enables snapshot chunk ids cache that is at the core of the optimizations. A list of snapshot chunks can be regenerated on the fly (as is done in the original version), but this is slow, we’re talking 15-20 minutes per run (more on lower power hardware as part of this time is CPU intensive), and it needs to be done at least 2x if running stats, and original version runs it 3x times in case of tabular stats. With caching enabled, loading snapshot chunks takes about 1 minute. The setting currently defaults to false, so this cache is NOT enabled by default. I’ll leave it to @gchen to figure out if this is something that should be enabled by default. I am pretty convinced that something like this will need to be enabled to be workable for really large datasets, though for small ones it may not matter
  • snapshot_chunks_ids_cache_root_dir - this is a path to the root of this new snapshot chunk ids cache if enabled. If this parameter is not set, then the cache will be created at the same location where other cache (/chunks, /snapshots) is located. The reason why this cache location can be overridable is that this cache can be large, and you may want to place it on a faster media such as SSD.

Will probably take a look at prune functionality now, based on what I’ve heard it is not really usable with large datasets as of right now. But I strongly suspect that prune is similar to check in many ways, so there is a good chance that we can get similar improvements there as well.

2 Likes

Alright, so I did take an initial look at prune functionality, and here are some observations. It is more difficult to do proper profiling as prune is a destructive operation, and I can’t recreate 20TB storage snapshots for each run. So for now, I focused on dry-run calculations - obviously, that’s not the whole story, but we’ll get to that later.

I did dry-run prune on my dataset with -keep 0:360 -keep 30:90 -keep 7:30 -keep 1:7 retention policy, this would remove about 800 (80%) of all revisions, but only about 250k (6% or a bit more than 1TB) of all chunks. Original version for this run goes like this:

  • 20 minutes for non-exhaustive prune; this is mostly :d: internal processing, there is almost no dependency on storage API calls
  • almost 2 hours for exhaustive prune; this consists of 80 minutes of listing all chunks on the remote storage (same timing as same operation for check), and about 25 minutes of internal :d: processing.

Internal processing between non-exhaustive and exhaustive prune are close enough, though what they do is different. They would differ in timing for non-dryrun mode, more on that later, but for now the big difference is listing all the chunk files which is a slow operation (same as for check). Obviously, if you have a fast storage, than list chunks component could be significantly smaller part of the total.

Now, without doing too much prune-specific work, it was easy to extend previous PR for check optimizations to prune, namely support for snapshot chunks ids cache and reading chunk file list from cache. Both caches are exactly the same as for check, prune just needs to use these. Just doing that brings internal processing time of prune from 20-25 minutes down to 1-2 minutes. If chunk file list cache is used then the whole exhaustive prune dry-run finished in 1 minute instead of 2 hours.

With this setup, exhaustive prune is actually faster then non-exhaustive (though both are really fast). The reason for that is that both need to loop over chunks of all revisions that are NOT being deleted, but non-exhaustive also needs to loop over the chunks of all revisions that ARE being deleted, and this is slower than simply ingesting a list of all chunks files for the exhaustive version.

Now, normally operations wouldn’t be reading chunk list from cache (as discussed in the check optimization sections), but now there seem to be a great synergy across multiple operations performed in sequence. For instance, it is common to run check then prune in sequence (sometimes the other way around). Generally, check would need to read a list of all the chunks anyway, meaning if we run check then exhaustive prune, normally we would need to read all chunk file list twice, which would take almost 3 hours by itself (probably more if you get throttled). But now we can run regular check (e.g. slowly reading chunk list from storage, storing in cache) and then use cached chunk list by exhaustive prune (blazing fast for the dry-run).

But wait, there is more :wink: The part that was not covered in the timings above is obviously non-dryrun part of actual fossilization/removal of chunks. This part is likely going to dwarf overall timing for heavy initial prunes such as the one in this usecase (this is not necessarily true for incremental prunes). As I haven’t actually run non-dryrun extensively, a few things here are conjectures based on code reviews. Hope @gchen can clarify if anything here is off.

Alright, so it seems to me that exhaustive prune should be faster not only on the calculation part, but also on the fossilization/removal part. We’re talking about a factor of 2x here, which potentially is saving hours if not days off the heavy prune operations on slow storages. The reason for that is that exhaustive prune operates on chunk files, meaning for every chunk that needs to be fossilized/removed it already knows chunk file path, which is supplied to chunk operator, meaning chunk operator only needs to do a single (1x) storage API call to either move file (to fossilize) or to delete file (to safe remove fossil).

Non-exhaustive prune, however, seems to needs at least two (2x) API calls to do the same work in most cases. The reason for that is that non-exhaustive prune operates on chunk ids (populated from snapshot revisions) rather than file names. This means that in the current implementations fossilization /removal operation will NOT supply chunk filepath to the operator, which means operator will need to find chunk first (FindChunk). This is a non-trivial operation which supports multiple nesting levels, but even if we use 1/1 and hit it right away, it will at the very least have to stat a potential chunk filename (1x API call) and then perform an actual move/delete operation (that’s another 1x API call). So in all likelihood, if you have non-trivial number of chunks to be fossilized/removed by prune, and you’re on slow storage, you might be better off running exhaustive rather than non-exhaustive prune - as counterintuitive as it sounds (this might be the case even if you’re NOT using cached chunk file list). @gchen, does this sound about right?

Now, while listing all chunk files at least uses paging (1000 entries per request for OneDrive), so it is slow but not that slow, big prunes would be THAT slow. Even with a single API call per unreferenced chunk, these chunks are operated on one-by-one (though threaded, but it doesn’t help that much). So if you have a significant number of chunks to remove, this may take days. In a way, this is similar to a backup - if you want to upload 20TB of data, it is going to take a long time. If your 20TB are small incremental changes over a long period of time, then everyday incremental backup is very fast. I can imagine that running similar incremental everyday prune shouldn’t be too bad. But a first chunky operation would likely be rough.

Now, there is some additional room for improvement for storages like OneDrive and GoogleDrive, and that is batching. Especially for fossilization/removal requests that are independent from each other, batching 20 of them in a single request helps with latency a great deal (throttling rules still apply though). There is a possibility of decent gains to be had here for these storages, but it will need some work as it won’t be trivial to plug it into existing framework. Also, realistically it will be a big help for prune only, unless it can also be done for chunk listing, in which case it may have benefits in a number of places.

2 Likes

Am loving your analysis so far on optimising Duplicacy at scale…

While I don’t have a good understanding at the code level, I’m quite familiar with how Duplicacy does its checks and prunes so I find this stuff fascinating, particular because I’ve come across the same limitations.

Right now, I’m running a prune -delete-only -exclusive on a fairly large Vertical Backup storage, with >1.2TB vmdk images, and about 3.5m chunks, on a local ext4 drive. This was after running a prune -keep * -collect-only (to remove the usual snapshots that didn’t get removed) and before that check -fossil -resurrect because I’d found a bunch of snapshots with tonnes of missing chunks; presumably because the chunks were deleted but the snapshot file didn’t. Needless to say this whole process is sloooooow.

Personally, I’m a bit sceptical of any non-reusable caches, or anything that uses a significant amount of local cache storage. IMO, Duplicacy could be optimised at the design level, and I have a few ideas but unsure of their feasibility outside local storages (which I know are achievable).

For instance, the main issue I run into is large numbers of files. Even on a local ext4, this time to list can be insane especially on mechanical HDDs. Wouldn’t it be nice if Duplicacy could ‘pack’ many older chunks into big monolith files? Plenty of programs do this - Crashplan, Windows Server Essentials Client Computer Backups, Veeam Agent(?), and even git packs objects into such structures. Whether this can be achieved on non-local filesystems, I’m not sure. It’d require seek-write support, and a whole level of logic to index, pack and repack (defrag) chunks within such files. But boy wouldn’t it be nice to have.

Another thing I’ve been wondering about (wrt to large local storages; at least on ext4) is to manipulate the chunk directory levels at a smaller scale than two hex digits. ATM, the default of one level with 256 subdirectories is good for most cases. But the next level up - 655365 - is a bit over the top. What if we could have one digit = 1 level. We’d have a few more possibilities - 16, 256, 4096, 65536.

Also, would it be wise to multithread the ListAllFiles() process for local and sftp storages, or at least predict the desired level of threads instead of use a hard -threads - based on the number of files in each dir?

I know Duplicacy is meant to be lock-free, but a lot of these scalability issues could be solved by having some degree of locking and maybe even a journal or index stored on the storage - even just with special maintenance operations, such as -exhaustive - and y’know what, I could really benefit from a temporary cache right about now. Even if I wouldn’t use it long term. Imagine doing a single ListAllFiles() and Duplicacy keeping a live cache, even after new backups and prune operations, updating an index on the storage. You could even reverse diff this with the last revision of each snapshot to store only the outliers, so long as it’s an accurate picture.

Furthermore, why can’t Duplicacy use weak lock files to indicate when a backup or prune failure occurs, or even when a backup is running - to avoid assumptions about -exclusive access and directory caching.

Just some ideas.

I think a lot of your ideas are predicated on your usecase of using :d: with a local storage, I’d have to disagree with you on a number of things with respect to remote storages :wink:

That’s why I’d never run -exclusive mode for prune ever, even though I know that I only ever backup from a single node. Exclusive mode is straight up dangerous, and not just for reasons of running something else in parallel. It messes up your storage if prune terminates for whatever reason midway, which is not unheard of for remote storages for sure. It doesn’t matter if your prune was the only operation on the storage. Just ignore that exclusive mode exists, and run the default two stage operation. It would take a bit longer to get rid of the chunks, but it makes it much safer. As you know, dealing with missing chunks sucks.

Why is that? If you’re dealing with slow remote storage, no matter what you do the storage is going to be your bottleneck, and the only ultimate way to bypass that is to NOT call remote storage if possible. Hence cache, cheap way of producing massive speedup if done right. There are reasons why caching it used everywhere in computing, starting from CPU design and all the way down to remote cloud storages.

Are you talking about listing source files for incremental backup, or listing chunks on storage? I am using :d: with SMB mounted RAID of HDDs, and listing of files is definitely not a big deal. At the very least not comparing to anything involving truly remote storages :wink:

No, no it would not, certainly not for cloud storages. One of the key design ideas of :d: is that chunks are immutable, they’re either there or not, but once you know the id you know the content is the same, and it will never change. It allows for quite a few things that would not be possible otherwise. Cloud storages are not designed to support in-place modification. Plus, what you desire can be easily accomplished by simply increasing the chunk size if you want, this will make many small chunks into fewer bigger chunks, though it will still not modify the content in-place.

Can’t speak to other ones, but I can speak to Veeam Agent. Don’t know if the others support multi-cloud endpoints, but Veeam packing that you’re talking about is for local storages again. Incidentally, VA also supports (used to?) direct backup to OneDrive, but do you know that storage format there is not the same as for local? Here is how VA block storage for OneDrive looks like:

BlockStore\{1489b64a-be49-43ed-bec2-e7e41c371956}\00\0003178f323760d2f9e2b1dd1df5c39d

Looks familiar? They do the same chunking as :d:, with the same 00-ff upper layer of folders, though they keep XX prefix for the chunks (:d: doesn’t), and they use 128 bit hashes instead of :d:'s 256 bit. VA also uses much smaller chunks too, so there are more of them. Again, there is a reason why this kind of layout is used for cloud storages :wink: It also works well with object blob storages which are prevalent in the cloud.

That’s one thing that can definitely be implemented as this functionality is storage-specific, I am looking at doing something similar of OneDrive, we’ll see.

If there is one thing I learned, is that scalability issues are never solved by any degree of locking. IMO :wink: Again, this is one of the core design principles of :d:, and I am really glad that we have it here. If someone wants to go into direction of lockable storages there are other options out there I am sure.

This could be done, but again, only for something that effectively runs in exclusive mode. It’s a lot of work, and probably won’t work if there are multiple clients. I was thinking about that, but chose not to go that path even for a single client. The thing is, listing files shouldn’t be a heavy operation, but it is in many cloud storage cases. The better way to do that for cloud storages where you can have local access remotely (e.g. SFTP, Azure VMs etc) is to have a cloud server that lists cloud files locally, then ships the whole list file to :d: This would improve things by several orders of magnitude, and won’t be hard to implement. But it won’t work for all cloud storages.

Keep in mind, I do use Duplicacy with local, network share (CIFS/SMB), sftp, and cloud (Google Drive) in equal measure. :slight_smile: Am aware of the scalability issues, regardless of backend, but the point I was making is that simply listing files is really one of the big pain points that could and should be solved universally.

Indeed, very aware of the dangers. :slight_smile:

However, running -exclusive becomes an absolute requirement when the storage gets in a corrupt state (usually because prune deleted the chunks before successfully deleting the snapshot file, which really should be the other way around).

I’m (still) running it now on my VB storage, and have paused backups to get the cleanup done. Leaving it up to the two-step process would take much much longer and I wouldn’t be able to confirm if it was in a consistent and ‘good’ state otherwise - before resuming proper backups.

Doesn’t happen often, but when check is suddenly failing all over the place, you can’t make assumptions or wait that long (prune > backup > prune).

Again, very aware of the purpose of cache - been using caches since the Atari ST days with great effect. They’re great. :slight_smile:

However, there are several caveats with using a cache. The most important is accuracy - if it’s wrong, in a distributed environment, it can go very wrong. It’s already difficult performing atomic operations on a storage when listing files can take > hour, so I believe rough assumptions about the state of a storage should be reserved to maintenance operations only (like when using -exclusive).

As I said, I could definitely benefit from a local cache right now, but I’d prefer if any such cache - for regular use - was relatively small AND reusable (otherwise it’s just a large SSD-wearing scratch file).

If that’s feasible - small, reusable - defo interested in that!

Listing chunks on storage. Try it on a single, local, ext4 drive with 3.5m chunks. It’s horrible.

Haven’t looked at every backend, and assumed as much re lack of seek API, but in-place writes isn’t the only way to accomplish this.

Even now, client incremental backups don’t even check if a chunk exist - that it knows exists, from the last snapshot - and will skip it totally even when it’s actually missing. Instead, chunks could be written directly to new pack files in sequence, many chunks in one, and still remain ‘immutable’.

But you’d have to replace the chunk database (filesystem-based) with a journal of indexes. Certainly not easy to implement, but workable in theory, for both local and cloud.

I mention packing because increasing chunk size is the ugly fix that pack files attempts to solve (i.e. worse de-duplication). e.g. Windows Server Essentials Client Computer Backup stores data in monolith 4GB blobs, but each stores ‘chunks’ at the sector/cluster size - as small as 4KB. This allows for perfect levels of de-duplication across multiple client machines, while not requiring literally billions of files.

Also network shares, which isn’t chunked.

Interesting! Have to admit, I didn’t know this. Goes to show, there’s some benefit in treating each storage type differently. I believe this is partly why Duplicacy used to do 2 and more chunk directory levels (although now defaults to 1).

Ah yes, a backend agent. Well, some backup tools do this (restic?) so I’m not totally against the idea, but a new client-server ‘Duplicacy’ REST-like backend protocol could solve more than just this issue.

That’s why immutable chunks and revisions are so important, you can safely cache any of these because content never changes, only presence or absence of these, and for that you cannot make any reliable assumptions in multiclient environment regardless, at least not without locking. Very few if any :d: operations are expected to be atomic, which is great.

Chunk id cache in my PR is reusable, though not necessarily small. But for my use case I’d take <1% of total storage space allocated to cache if it saves hours of runtime every day.

I don’t run large local storages, but something is wrong here (or horrible means different things for us :wink: ) I have slightly more chunks on OneDrive, and listing all chunks takes about 80 minutes. Which is certainly not great, but workable for daily operations (and that’s only needed for check, really). But I can’t imagine that it takes anywhere close to that long for local storage. How much time are we talking about here? And are you sure it is actually listing files, and not reconstructing chunk ids (this is what my PR is caching), because with these datasets :d: spends a lot of time churning that, which is NOT listing chunks. You might be barking at the wrong tree here; or, something is wrong with implementation.

P.S. Actually, just ran dir -1R on multilevel folder with ~1.3mm files, and it did take about 15 seconds. So listing all your local chunks shouldn’t take more than a minute, unless something is wrong with the implementation for local storages.

And what do you know, after I started to look into performance of file listing, it turns out that OneDrive storages do not support threaded file listing at all, -threads parameter only applies to chunk operators and is completely ignored for file list ops. So here is another big opportunity for improving performance of slow operations in large datasets!

Long story short, I transplanted GDrive threaded listing implementation for OneDrive backends, and did throw in support for API batching. OneDrive for Business uses Graph API, and Graph API can package several API calls (up to 20) into a single POST payload, and thus save on network latency with respect to API calls. And then I ran some different scenarios for my use case(see below). TL;DR - chunk listing operation is now faster by about factor of 3x, from almost 1.5 hrs down to less than 30 minutes. This is very significant in a context of other improvements mentioned in this thread, as chunk listing is something that takes the most time at the moment, and is not something that can be avoided to be done at least once per cycle.

So this is how scaling with respect to threads looks like without batching (all times are in minutes):


So this is how scaling with respect to threads looks like with batching (max allowed requests per payload at 20):


These numbers are the best case scenarios observed over several runs. There can be a significant degree of variability based on how request throttling happens, especially for higher number of threads. With that caveat, here are some observations based on these results.

For non-batched case, there is a massive improvement from 1 thread up to 3-4, so sticking with 3-4 threads already gets you most of the benefit of multithreading. Then there are marginal improvements in total time up to about 16-32 threads, and then at 32+ there is no additional improvement and may be a slight deterioration (but these differences are within margin of error). Interestingly enough, even with massive number of threads (e.g. 256) there is no significant deterioration in total time, despite the fact that most of the threads are sitting in throttling delays most of the time. It appears that with higher number of threads there is more consistency in the total time as with fewer threads if one of the fewer threads gets throttled more than the others the total time can balloon quite a bit (throttling delays tend to be about 5 minutes long). I saw 4-thread runs (normally about 35 minutes) go for almost an hour. But with significantly higher number of threads you’re basically hammering API endpoints, so you may not want to do that for relatively marginal speed improvements.

Batch listing looks a bit different, even single-threaded version already saves quite a bit of time (as there is effectively a degree of parallelization on the API endpoint side). We’re getting improvements up to 3-4 threads, and then time is basically stable and does not decrease (nor increase) with additional threads. Total time in batched case converges to about the same 30 minutes mark, though in the best cases with hammering API with tons of threads non-batching can do a bit better. Batched runs were significantly more consistent run-to-run though. Also, depending on your connection to API provider these results my differ for different latency/bandwidth combinations.

Batching may also be more relevant for operations like chunk rename/delete as presumably in these cases latency would be more relevant (payloads are very small), while in the case of file listing responses are non-trivial (1000 filenames/sizes). But that’s a separate story.

So implementation-wise, -threads parameter now applies to chunk file listing operation on OneDrive, by default in non-batching mode. There is a new parameter added to control batching for a specific storage, or used via environment variable override as per usual with DUPLICACY_storagename_ prefix.

  • odb_max_batch_requests - if this is set to a number N (as a string), then ODB will perform chunk file listing operations using batches of N requests (N capped at 20). If it is set to “max” the batch mode will be enabled with maximum allowed requests per batch (currently 20). If this is set to anything else (or not defined as is default), then batching mode is disabled.

I’ll submit PR with these changes shortly, will post here when done.

2 Likes

PR updated with pruning optimizations:

There is a new parameter that can be added into preferences keys for a specific storage, or used via environment variable override as per usual with DUPLICACY_storagename_ prefix.

  • prune_reads_chunk_filelist_from_cache_only - if this is set to true, then listing of chunks files (during exhaustive prune) bypasses pulling it from storage (could be very slow for remote storages) and reads it straight up from cached file on disk (this file is regenerated every time listing IS pulled from the storage). Most of the time it should be set to false (as is default) as most of the time we want to see the most recent chunk file list. However, if you’re running sequential check then prune, then it makes sense to keep similar parameter for check disabled (so check reads from remote storage and updates cache), but enable it for prune (so prune won’t be pulling the same list from the remote storage and go straight to cache).

  • snapshot_chunks_ids_cache_enabled - same parameter and meaning as discussed for check, see above

  • snapshot_chunks_ids_cache_root_dir - same parameter and meaning as discussed for check, see above

2 Likes

And here it is:

1 Like

OK, and here is the final benchmark, baseline vs optimized version. The storage is the same as described in the first post and so is the baseline code, while optimized code incorporates both PRs (check/prune improvements at 970d59c and multithreaded ODB file listing at 488abc3) off the same baseline. My benchmark is running two commands in sequence (check+prune):

  • -log check -storage ODrive01 -threads 32 -a -tabular
  • -log prune -storage ODrive01 -threads 32 -a -keep 0:360 -keep 30:90 -keep 7:30 -keep 1:7 -dry-run -exhaustive

Settings for the new parameters are as following:

  • "odb_max_batch_requests": "disabled"
  • "check_reads_chunk_filelist_from_cache_only": "false"
  • "prune_reads_chunk_filelist_from_cache_only": "true"
  • "snapshot_chunks_ids_cache_enabled": "true"
  • "snapshot_chunks_ids_cache_root_dir": "<directory on SSD>"

So no batching (as we run with 32 threads), check command (that goes first) reads chunk file list from storage and caches it, while prune goes straight to the cached file list version. We also enable snapshot chunks ids cache from the first PR, and locate it somewhere on a fast drive.

Optimized version is timed on the second run, as the first run (from scratch) takes a while to create snapshot chunks ids cache, but day to day operations are representative of the second run. First run is still way faster than the baseline.

With this setup, here are the timings:

*- baseline: 4 hrs 23 min (263 min)
*- optimized (1st run): 55 min
*- optimized (2nd run): 37 min (7x speedup vs baseline!)

In the optimized run, almost 30 minutes out of 37 is straight up listing of chunk files on storage, which is pretty much as optimized for ODB as it can be at this time, so additional opportunities for improvements are limited. On the other hand, if you’re running on fast/non-throttled storage, your speedup will likely be even more dramatic as file listing would take much smaller portion of overall execution time.

With snapshot chunks ids cache disabled (snapshot_chunks_ids_cache_enabled set to false) total execution time is 67 minutes, so it is almost double. Also, if your file listing time is much faster (it is also not affected by this caching), then slowdown is about 4x times vs the cached version (~10 min vs 40 min).

Memory consumption is also significantly improved, but was not benchmarked in these runs as these were run without profiling, to make it as close to production runs as possible.

This is good enough for me. Even with an order of magnitude (10x) increases in time and memory this is still quite viable for overnight runs (we’d be looking at ~6 hours and ~16GB of memory consumption), and that was the objective of this optimization project. Even with 2 orders of magnitude (100x) increases it might be somewhat viable, though only marginally so. These would probably be more like weekly runs (won’t fit overnight), and memory consumption would require quite beefy hardware setup (certainly not impossible though). Projections into 100x capabilities are pretty sketchy though, as a few things are not linear in terms of performance, so things may deteriorate much faster than anticipated.

Having said that, 100x usecase comparing to mine is still quite extreme (we’re talking petabyte scale), so this might be warranted. Also, with such usecases you probably want to use storage that doesn’t throttle your API requests, and in this case even 100x looks potentially quite viable, as right now file listing is the limiting factor. The whole operation takes barely 10 minutes if you remove file listing, so even at 100x it is well within 24 hours.

3 Likes