Check is running slow on local storage

Context: I have a ~7TB backup to an external 12TB drive. There are about 1.5 million files in the duplicacy backup folder. I’ve scheduled a “check” after each backup to refresh the stats in the web GUI.

My problem is, that this check runs for more than 2 hours every day.

I’ve tried to search similar issues in the forum. I’ve found two threads but both of them seems stalled.

Based on the logs it looks for just existence of the files for nearly 1 hours. Then it does “nothing” for another hour and finally is spits out the statistics.

Running check command from S:\duplicacy-web/repositories/localhost/all
Options: [-log check -storage WD-12TB -a -tabular]
2023-12-10 22:33:53.649 INFO STORAGE_SET Storage set to B:/Duplicacy
2023-12-10 22:33:53.686 INFO SNAPSHOT_CHECK Listing all chunks
2023-12-10 22:35:45.191 INFO SNAPSHOT_CHECK 2 snapshots and 846 revisions
2023-12-10 22:35:45.232 INFO SNAPSHOT_CHECK Total chunk size is 6779G in 1451881 chunks
2023-12-10 22:35:48.121 INFO SNAPSHOT_CHECK All chunks referenced by snapshot Shared at revision 1 exist
2023-12-10 22:35:50.451 INFO SNAPSHOT_CHECK All chunks referenced by snapshot Shared at revision 6 exist
2023-12-10 22:35:52.894 INFO SNAPSHOT_CHECK All chunks referenced by snapshot Shared at revision 8 exist
2023-12-10 22:35:55.701 INFO SNAPSHOT_CHECK All chunks referenced by snapshot Shared at revision 10 exist
[...]
2023-12-10 23:23:37.343 INFO SNAPSHOT_CHECK All chunks referenced by snapshot Private at revision 550 exist
2023-12-10 23:23:40.290 INFO SNAPSHOT_CHECK All chunks referenced by snapshot Private at revision 551 exist
2023-12-10 23:23:44.112 INFO SNAPSHOT_CHECK All chunks referenced by snapshot Private at revision 552 exist
2023-12-10 23:23:47.036 INFO SNAPSHOT_CHECK All chunks referenced by snapshot Private at revision 553 exist
2023-12-10 23:23:49.848 INFO SNAPSHOT_CHECK All chunks referenced by snapshot Private at revision 554 exist
2023-12-11 00:52:27.107 INFO SNAPSHOT_CHECK 
    snap | rev |                          |  files | bytes | chunks | bytes |   uniq |    bytes |    new |     bytes |
[...]

It takes 2-4 seconds to check each revisions. I don’t really understand why it so slow when every revision contains 99% of the chunks (therefore the same files that were already checked) as the previous revision. Why isn’t there a simple caching logic to store the already checked chunks?

Then it does something for another hour without any trace in the log. What does it do in here? I mean the files are already scanned, it knows their size and everything about them, does it really takes more than an hour to format that data into a table?

Is it possible to do something about this slowness? It doesn’t look right to take 2+ hours on a local drive.

The second thread here is mine, not sure why you consider it “stalled”. I did submit PR, there are some dramatic speed improvements for check and prune for large datasets. It’s been working great in production on my end since the time I submitted it. Whether or not it makes into the :d: mainline is up to @gchen. In the meantime, PR is on github, anyone can check it out.

I mean, the last comment is from February, without any feedback from the developers since then. The results look great btw, but I’d be happier if something “official” would happen with the PR soon. I don’t have enough experience to compile it myself.

Not enough users with large datasets, I suppose :man_shrugging:

If that is the case, then I should reconsider my choice of backup tools soon. I’m trying to minimize my energy usage, and wasting 2 hours every day does not help in that.

Those optimizations are not applicable to the local hard drive usecase. They optimize out latency accessing storage. In this case, storage itself has huge seek latency.

Check needs to touch each file. Seek latency on hdd can be 10-20ms. On a million files this is 3-6 hours just moving heads, before even actually reading data.

There is nothing that can be done without modifying the storage (e.g. using tiered storage with SSD to accelerate access to metadata), increasing chunk sizes (to reduce number of chunks), or not running check after every backup (pure waste of time altogether)

Those PRs have not been merged in my opinion because they only improve high latency storage that is poorly suited to host millions of files (various *drive services) in the first place, and therefore should not be used if such a massive number of files is to be expected. Backup to naked usb hdd is also quite pointless, to be frank — from reliability and data durability standpoint.

Is there any other way to update the web gui statistics?

It is still far better than nothing. I also have the same backup running to Google Drive, but I trust more in my own drive than in any cloud provider.

Considering your answer I have to look for an other backup solution then, because it will never be faster in my use case.

I don’t think so. I would ignore statistics. It’s not worth waiting 3 hours every time

This is highly misguided. You believe your single usb hard drive provides better data durability than commercial datacenter? This makes no sense, sorry. Or I misunderstand you. Please elaborate.

Hard drives are expected to fail in many ways: they develop bad sectors, rot, or can simply refuse to spin up one day. They are considered consumables. They are used in redundant arrays, where data is scrubbed monthly, and errors corrected as they occur, specifically for all those reasons.

Please don’t expect to be able to restore long term backup from a single hard drive. This is not realistic.

If you want to backup to local storage — you need a NAS with error correcting filesystem and performance optimizations to support small files usecase. But paying for cloud storage will be cheaper, considering maintenance requirements, electricity, amd upfront hardware cost, and you wont have single point of failure for all your data and backup: lightning, flood, power surge, etc.

I’ve suggested a few improvements above.

Any backup software that works on the same principle will experience exactly same issues — your problem is media slow seek time, not something with the backup solution. It’s inherent problem of a single HDD.

You need to store and access millions of objects — regardless how do you arrange things, access to millions of object will be painfully slow on any HDD.

But this is the least of your worries really. Data durability - or lack thereof — is much bigger issue

I don’t want to sidestep the topic. Basically every cloud storage contains blanket statements in their EULA that they can revoke your access for basically any reason and you can not do anything against that. On my own drive at least I know that I can access it any time when I want. Even if I do something online that can be considered inappropriate by a cloud provider.

That’s why I have cloud backup as a second layer. But I won’t trust in cloud to be my only backup, and it is getting too expensive at this size. I also run long SMART test on my drives monthly. I also have hash files to check periodically, duplicacy can also verify the consistency of the backup.

If my backup drive dies, I just buy another and restart the backup. If one of my primary drives fail, then I just restore it from local backup. If both die at the same time, then I hope my cloud backup works.

Adding ssd cache to an usb drive is not feasible. Building a second NAS just for backup is out of scope for me. Increasing chunk size breaks the copy-compatibility with the google backup. Not running check every time… that seems reasonable, but then why I pay for the GUI. Anyway, I will do that for now.

Probably, but I still want a simple one drive external backup solution, so I waste some time to look around. Thanks for the answers btw.

1 Like

Maybe, but probability of this happening is insignificant compared to that of a hdd failing, which is close to 100%: all drives eventually fail but vast majority of accounts aren’t banned. You are uploading opaque blobs strictly within ToS. They want you as a paying customer.

Imagine Amazon telling Bank of America: sorry, we are banning your account today out of the blue :slight_smile:

You can apply the same logic — if they ban you — you’ll start backup to another provider the same day.

Having local HDD backup is probably ok for local restores, to attempt to save egress traffic from the cloud, but I would expect every restore to fail, making it less reliable and slower.

Smart and checks cannot predict failure. They can detect some failures that have already happened (bad sectors), but not correct. By then data loss have already occurred. To maintain data consistency you need self-healing filesystem and source of redundancy. And then what smart says is irrelevant.

Duplicacy supports erasure coding to mitigate the risk of rot to some degree but it’s filesystem’s job.

From the cost perspective — some cloud providers provide limited free monthly egress, so cost is not the issue either.

Alternatively, you can backup to two cloud providers to mitigate ban risk. Still much better durability than an HDD.

If you are serious about keeping local version history — please consider NAS. You can build one from old enterprise hardware quite cheaply, including drives and SSDs. They are plentiful on eBay.

As an example, ZFS array of four 6TB used enterprise drives plus two SSDs for metadata will provide you the same 18TB of storage but with orders of magnitude higher durability and performance compared to a single 18TB hdd.

Sure. As long as you have cloud backup, and don’t rely solely on a proverbial “usb drive from Costco” to save the day — I no longer worry about your health of your data.

I don’t have any vested interest in what you do, but I have seen this approach fail before more than once. Feel free to ignore of course.

Cheers!

Going back to the original problem. I’ve realized something. Watching the check process with Process Monitor revealed that it doesn’t even use the backup disk.

Apart from the first 2-3 minutes when it reads about 500MB from the external backup disk, all it does is reading already cached chunks
on the “local” disk in …\duplicacy-web\repositories\localhost\all.duplicacy\cache\WD-12TB\chunks folder.

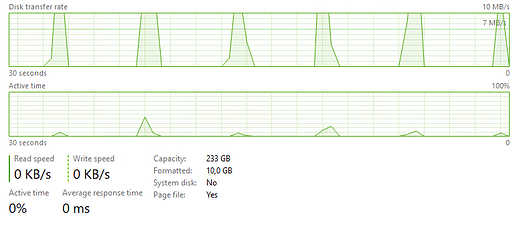
My internal disks are already SSD-cached with PrimoCache and I’ve verified that it is indeed works from SSD.
But it doesn’t read constantly, just in every 2-3 seconds, and between the reads, the disk activity is 0. If I disable the caching, the pattern is the same, just directly on the local disk instead of the SSD cache.

So while it was not intentional, I’ve already implemented your SSD caching suggestion, but it doesn’t help much.
Something must be there that limits the speed, because the disk activity is not continuous during checking.

Interesting!

What is the rest of the system doing? Latency on other disks on the system? CPU utilization?

How does the check command look, what arguments are you passing?

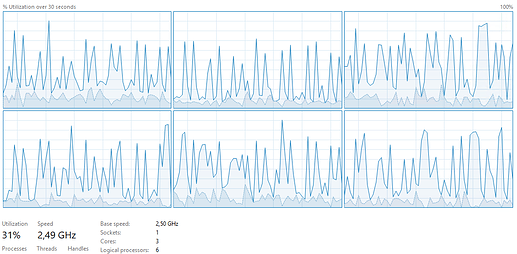
CPU is at 30% for the Duplicacy process, and it eats about 1.5GB RAM. Total CPU usage is about 40%. Other disks are near 0, the external backup disk is 0, the SSD is as you can see on the picture.

The parameters are the same as in my intial post:
Options: [-log check -storage WD-12TB -a -tabular]

I’ve tried to add -threads 4 and -threads 8 but there was no significant difference in the runtimes or in the disk pattern.
Now i’m going a little extreme with threads, but no apparent change.

I’m wondering if it’s doing it full speed single threaded, thus saturating single core worth of CPU, regardless of -threads parameter

So this is the rather simple process: duplicacy would download chunks needed to build and decrypt snapshots, and then validate that all files those snapshots reference actually exist on the target. So it’s a bit of read, some CPu use, and then a lot of stat.

Once you run that once, those metadata chunks would be cached locally on your accelerated volume by primo cache, metadata from the usb hdd would be cached in ram, so there really should be no disk access. Perhaps what you are seeing is additional metadata reads.

What filesystem is on hdd?

If this is the case duplicacy shall be operating on in-ram data and go full speed. It shall not be taking hours to essentially just do a lookup for a million or so files.

I can try making a backup of let’s say a terabyte worth of stuff to my local NAS and time check, to have an independent reference point.

In the meantime, you can try windows performance monitor to see if there are any other stats out of whack (e.g. excessive page faults, cpu stalls, context switches, etc). I’m a bit rusty on windows performance analisys to give more specific suggestions.

I would also try disabling primo cache to see if that changes anything. Depending on how did they implement the caching there could be additional context switches, or cache flushes, between kernel and user space, murdering performance of this specific usecase. If anything, to just rule out primo cache scheninigans.

Plot thickens! :slight_smile:

Here is my “C:\ProgramData.duplicacy-web\settings.json” for reference.

{
    "listening_address": "127.0.0.1:3875",
    "https_address": "",
    "https_domain": "",
    "temporary_directory": "S:\\duplicacy-web/repositories",
    "log_directory": "C:\\Logs/Duplicacy",
    "dark_mode": false,
    "cli_stable_version": true,
    "safe_credentials": false
}

C: is SSD. S: is HDD, but SSD-cached with a dedicated SSD drive with Primo. (I moved the temporary directory out of C drive because there was not enough space). B: is the external USB backup drive.

Every drives are NTFS.

I’ve added the duplicacy executable to Windows Defender exclusions. I also added the S:\duplicacy-web folder and also the original backup folder B:\duplicacy.

Now I’ve disabled Primo, the only difference is that the spiky read pattern moved to the S: disk. The overall speed is the same.

The CPU usage is balanced across the cores, there is no single 100% core.

Here is an excerpt of the Process Monitor log about the file reads:
Logfile.CSV.txt (943.8 KB)
You can see that sometimes there is 2-3 seconds delay between the CloseFile and the next QueryOpen, same as the spike pattern seen on the resource usage graph.

Windows likes to move the thread around allegedly to keep average load consistent for thermal reasons. But it does look like you have a consistent load worth of two core performance.

From your previous screenshot, 35% cpu usage, and next one, showing total of 6 non-HT cores, it looks duplicacy consumes almost exactly 2 cores worth of workload, and is indeed CPU bound.

I can’t think of why would that be the case. Maybe it attempts to do some cryptography to derive hashes of chunks and your cpu lacks hw support?

What cpu is that?

I don’t remember if windows has a way to profile a process to see what does it do that takes so much time, but go apps do have a build in profiler. I believe there is command line switch that enables a webserver where you can see stacks and what exactly is the app doing.

Let me try to find it.

Could not find it, but there is this tool that allows to dump stack: GitHub - google/gops: A tool to list and diagnose Go processes currently running on your system

Another idea: how long does it take to execute dir /s on the duplicacy storage? Does it also take massive amount of time or is it much faster? It’s supposed to recursively enumerate all files and their metadata — what is bulk of duplicacy check’s work.

In the meantime, questions for @gchen:

  • is check expected to run in two threads ignoring the -threads parameter?
  • is any cryptography involved on per-chunk basis?

CPU is Xeon E3-1265L V2, but 1 core is disabled in BIOS to avoid too much power draw in extreme loads, that’s why it is 3 core/6 threads in windows.

I will check the gops and dir /s tomorrow.

If you would actually look at the PR (or read the thread), you’d know that it is not true. The big part of the optimization has nothing to do with remote storages - standard :d: on a large data set out of, say, 2 hour check can spend an hour just re-calculating hashes and moving strings around in memory, without touching any storage at all. This is what @01cfbe32fed602e7b1ef is observing with :d: being cpu-bound (it will also blow up memory usage on larger sets).

For local storage that time dominates the check (and prune) times, and optimizations cut these down an order of magnitude or more. So it is much more impactful on local storage, where with remote storages a big chunk of time spent in access and cannot be reduced beyond certain point.

2 Likes

I’ll take a look, thank you. Perhaps I’ve confused it with the bulk list optimization on remotes like Google Drive.

If that’s the case, and Duplicacy does it in the single thread — that’s the culprit.