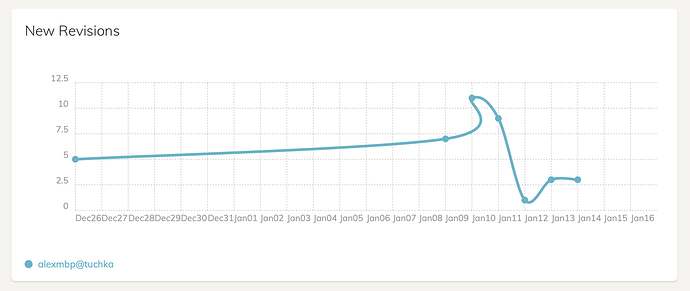
@gchen yes the page source does show chart data similar to what you quoted.
I had this problem in .8 and it persists with .10, and it the chart doesn’t render in both Safari and Chrome.
Here’s the source code snippet:
Chartist.Line('#Duplicacy.WasabiChartSize', {
    labels: [  "Jan05",  "Jan06",  "Jan07",  "Jan08",  "Jan09",  "Jan10",  "Jan11",  "Jan12",  "Jan13",  "Jan14",  "Jan15",  "Jan16",  "Jan17",  "Jan18",  "Jan19",  ],
    series: [

            [    133997527040  ,    284708306944  ,    486752124928  ,    617943662592  ,    716865273856  ,    824981848064  ,    848934469632  ,    941080182784  ,   null ,   null ,    998911246336  ,    998918586368  ,    1046934978560  ,    1046934978560  ,    1046934978560  ,  ],

            [    133990187008  ,    133990187008  ,    133990187008  ,    133990187008  ,    133990187008  ,    140911837184  ,    140911837184  ,    140911837184  ,   null ,   null ,    140911837184  ,    140911837184  ,    188928229376  ,    188928229376  ,    188928229376  ,  ],

            [   null ,   null ,   null ,   null ,   null ,    472784044032  ,    472784044032  ,    472784044032  ,   null ,   null ,    472784044032  ,    472791384064  ,    472791384064  ,    472791384064  ,    472791384064  ,  ],

            [   null ,   null ,   null ,   null ,   null ,   null ,   null ,   null ,   null ,   null ,    516253810688  ,    516253810688  ,    516253810688  ,    516253810688  ,    516253810688  ,  ],

    ]},
    {
        axisY: {
            labelInterpolationFnc: function(value) {
                return formatBytes(value);
            },
        },
        chartPadding: { left: 40, top: 20, },
        lineSmooth: Chartist.Interpolation.cardinal({
            fillHoles: true,
        }),
        low: 0,
    });

Chartist.Line('#Duplicacy.WasabiChartRevision', {
    labels: [  "Jan05",  "Jan06",  "Jan07",  "Jan08",  "Jan09",  "Jan10",  "Jan11",  "Jan12",  "Jan13",  "Jan14",  "Jan15",  "Jan16",  "Jan17",  "Jan18",  "Jan19",  ],
    series: [

            [    1  ,    1  ,    1  ,    1  ,    1  ,    3  ,    3  ,    3  ,   null ,   null ,    4  ,    5  ,    6  ,    7  ,    8  ,  ],

            [    1  ,    1  ,    1  ,    1  ,    1  ,    2  ,    2  ,    2  ,   null ,   null ,    2  ,    2  ,    3  ,    3  ,    3  ,  ],

            [   null ,   null ,   null ,   null ,   null ,    1  ,    1  ,    1  ,   null ,   null ,    1  ,    2  ,    2  ,    2  ,    3  ,  ],

            [   null ,   null ,   null ,   null ,   null ,   null ,   null ,   null ,   null ,   null ,    1  ,    1  ,    1  ,    2  ,    2  ,  ],

    ]},
    {
        chartPadding: { left: 40, top: 20, },
        lineSmooth: Chartist.Interpolation.cardinal({
            fillHoles: true,
        }),
        low: 0,
    });

Chartist.Line('#Duplicacy.WasabiChartChunk', {
    labels: [  "Jan05",  "Jan06",  "Jan07",  "Jan08",  "Jan09",  "Jan10",  "Jan11",  "Jan12",  "Jan13",  "Jan14",  "Jan15",  "Jan16",  "Jan17",  "Jan18",  "Jan19",  ],
    series: [

            [    27138  ,    56912  ,    97746  ,    123977  ,    143484  ,    164648  ,    169321  ,    187191  ,   null ,   null ,    198182  ,    198186  ,    207958  ,    207958  ,    207958  ,  ],

            [    27136  ,    27136  ,    27136  ,    27136  ,    27136  ,    28673  ,    28673  ,    28673  ,   null ,   null ,    28673  ,    28673  ,    38445  ,    38445  ,    38445  ,  ],

            [   null ,   null ,   null ,   null ,   null ,    94391  ,    94391  ,    94391  ,   null ,   null ,    94391  ,    94395  ,    94395  ,    94395  ,    94395  ,  ],

            [   null ,   null ,   null ,   null ,   null ,   null ,   null ,   null ,   null ,   null ,    101247  ,    101247  ,    101247  ,    101247  ,    101247  ,  ],

    ]},
    {
        axisY: {
            labelInterpolationFnc: function(value) {
                return formatNumber(value);
            },
        },
        chartPadding: { left: 40, top: 20, },
        lineSmooth: Chartist.Interpolation.cardinal({
            fillHoles: true,
        }),
        low: 0,
    });


$('a[data-toggle="tab"]').on('shown.bs.tab', function (e) {
    target = $(e.target).attr("href");
    $(".tab-pane").each(function() {
        name = "#" + $(this).attr("id");
        if (name != target) {
            return;
        }
        ($(this)).find('.ct-chart').each(function (i, e) {
            e.__chartist__.update();
        });

    });
})


$(":input").on("input", inputChanged)
});


